01Undergraduate thesis · 2026
Rice Harvest Readiness from Drone Imagery
Raw drone photos in, a field map and a harvest verdict out. A three-tier system that runs fully offline on a single field laptop, with no cloud service.
Overview
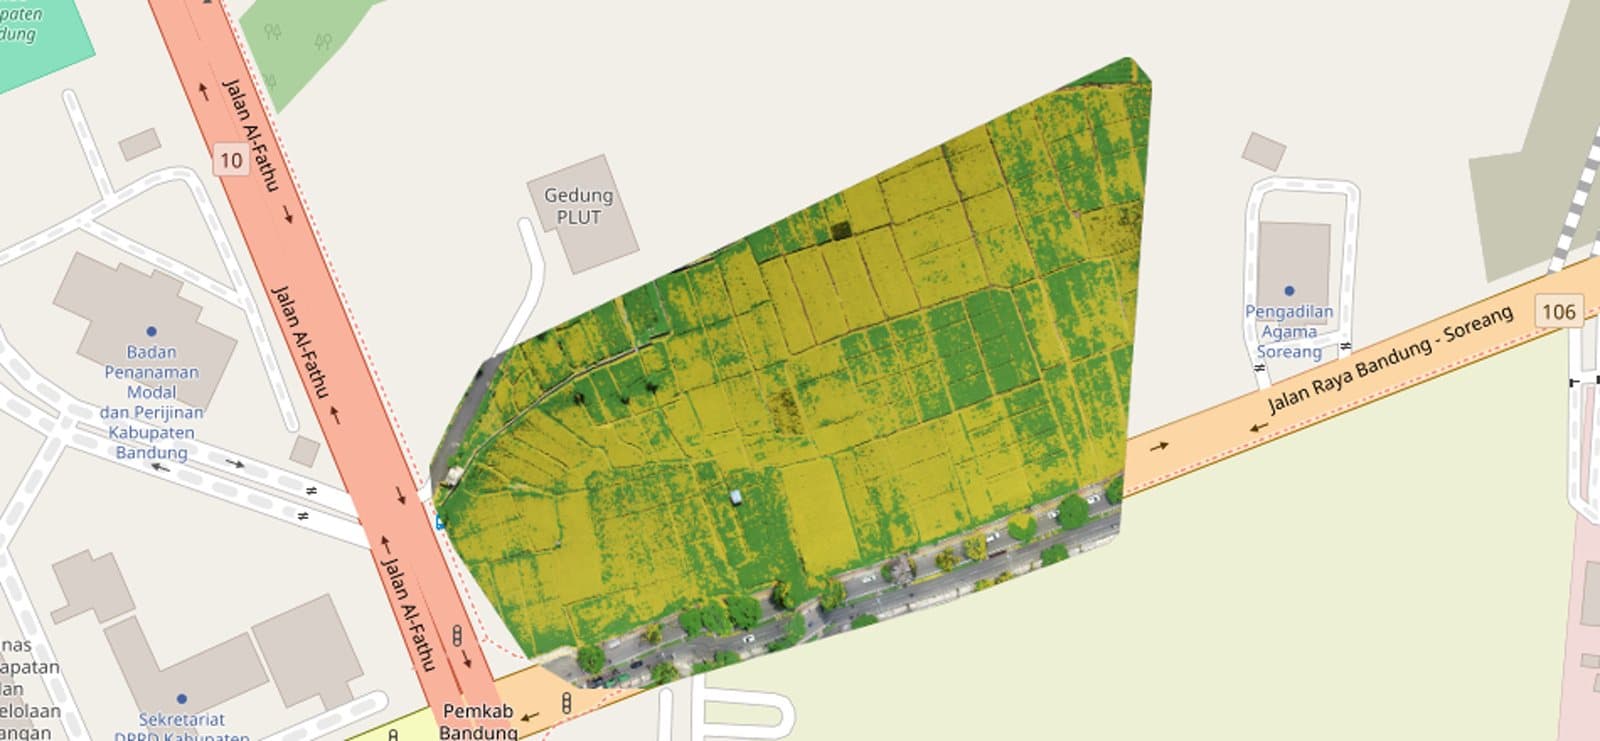
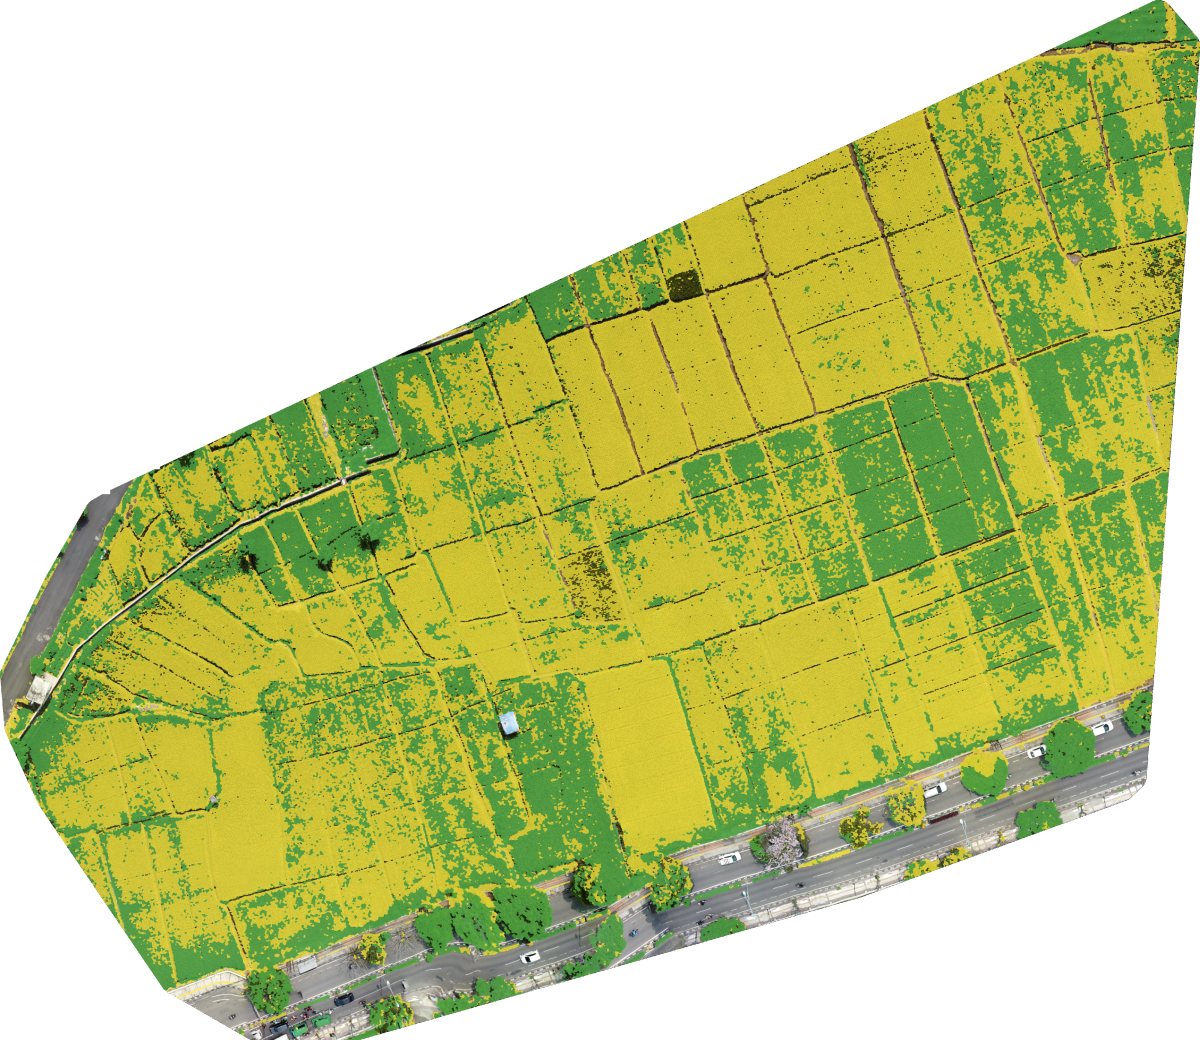
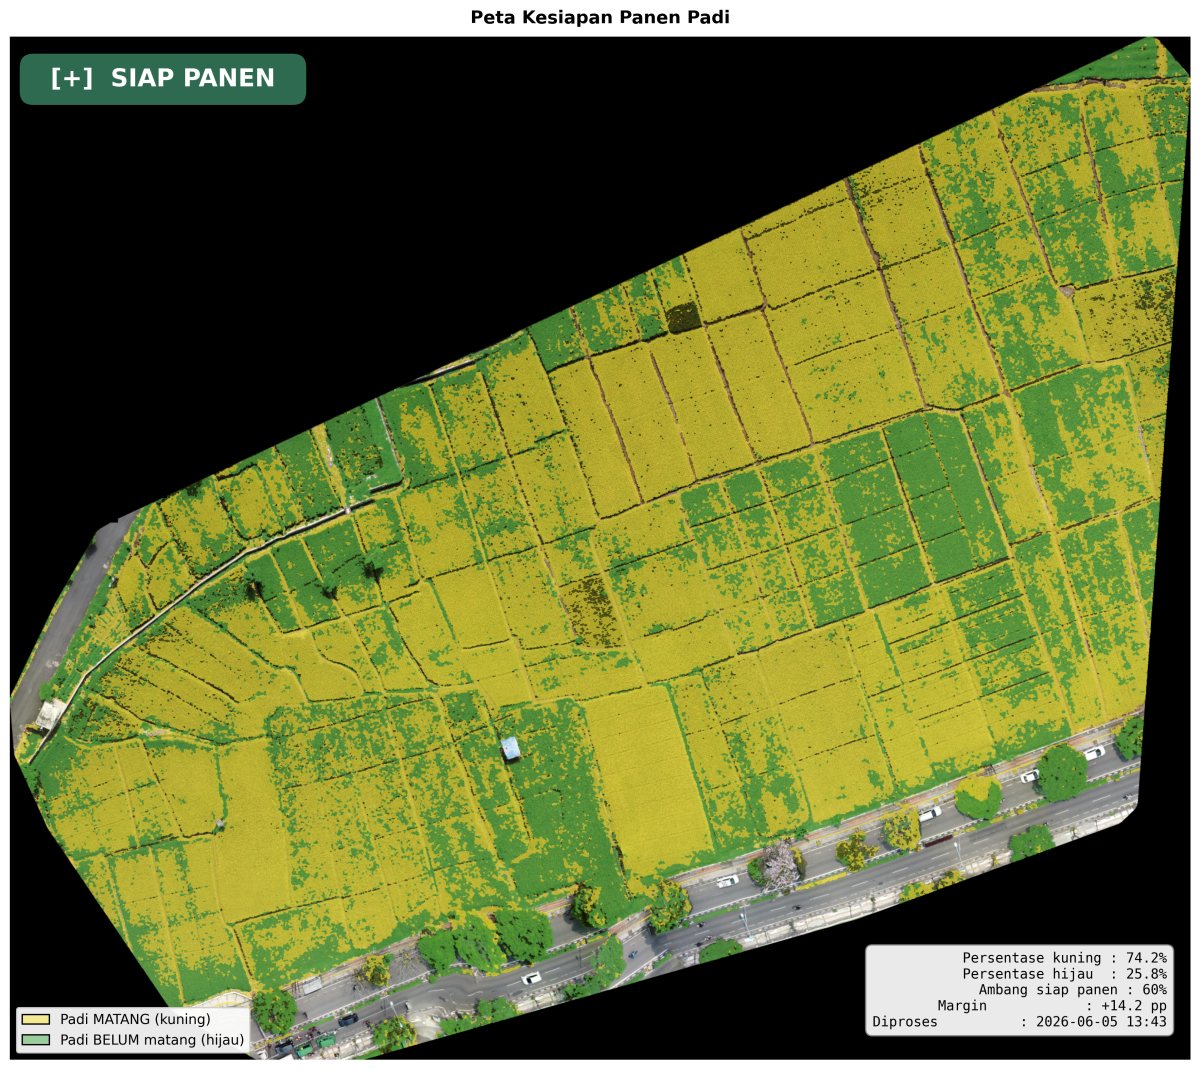
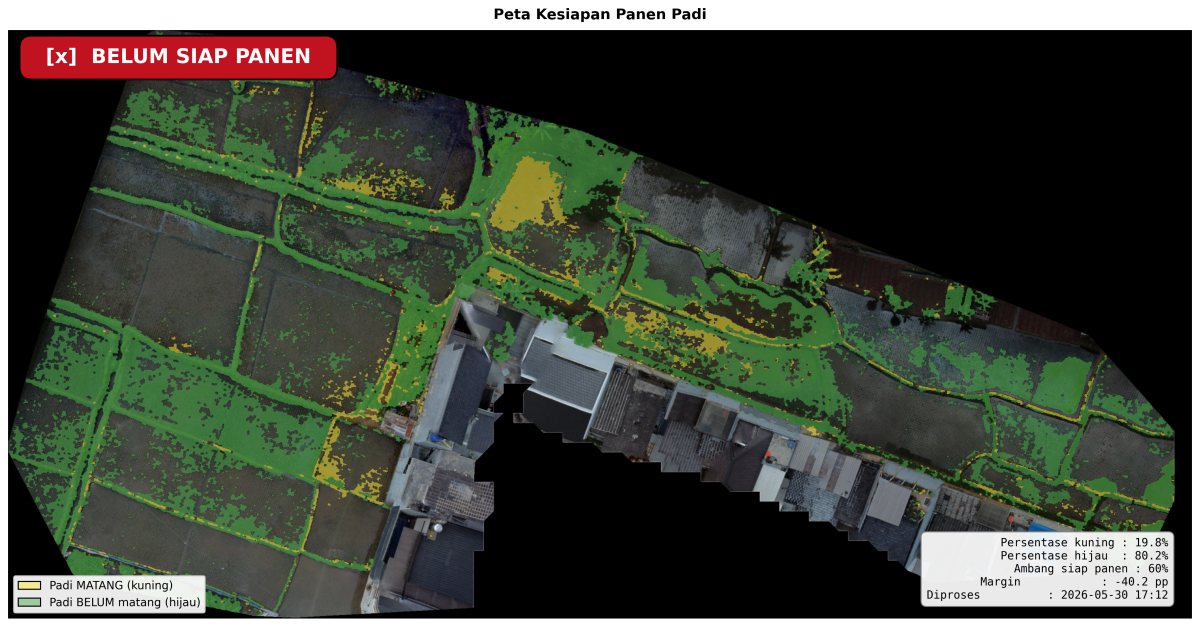
My thesis is titled "Detecting and Mapping Rice Harvest Readiness from Drone Imagery with Edge Computing and a Geographic Information System (GIS)". Drone photos of a paddy are processed on a single laptop into a map of which parts are ripe, with a harvest verdict and downloadable GeoTIFF files.
Stitching, segmentation, and export run offline from start to finish. The internet is only used to load OpenStreetMap tiles behind the map, and without it the orthophoto and classification layers still show.
I used HSV segmentation rather than deep learning: rice ripeness shows clearly as the canopy shifts from green to yellow, it runs fast on a laptop without a GPU, and every decision can be explained from the threshold values.
- per pixel
- 5 cm
- REST endpoints
- 12
- harvest threshold
- 60%
Main stack
- Python
- OpenCV
- Rasterio
- FastAPI
- SQLite
- Docker
- NodeODM
- Next.js
- Leaflet
Processing pipeline
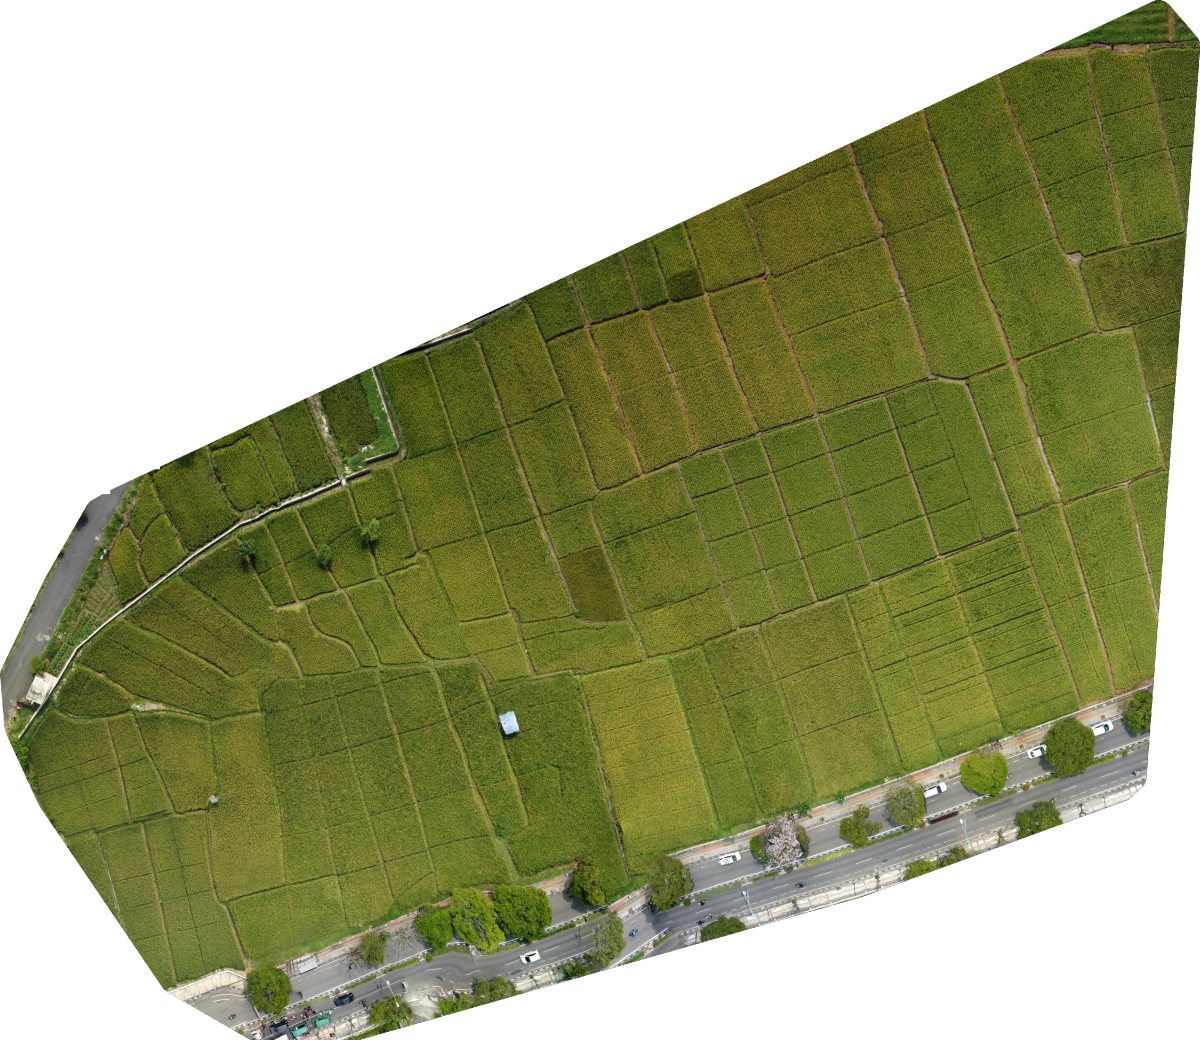
- Drone photos (JPG with GPS in EXIF, 70–80% overlap) are stitched by NodeODM into a georeferenced GeoTIFF orthophoto, targeting 5 cm per pixel.
- Gaussian Blur and CLAHE preprocessing, then RGB to HSV conversion.
- HSV thresholds produce a yellow (ripe) and a green (unripe) mask, cleaned with morphology. The two hue ranges deliberately do not overlap.
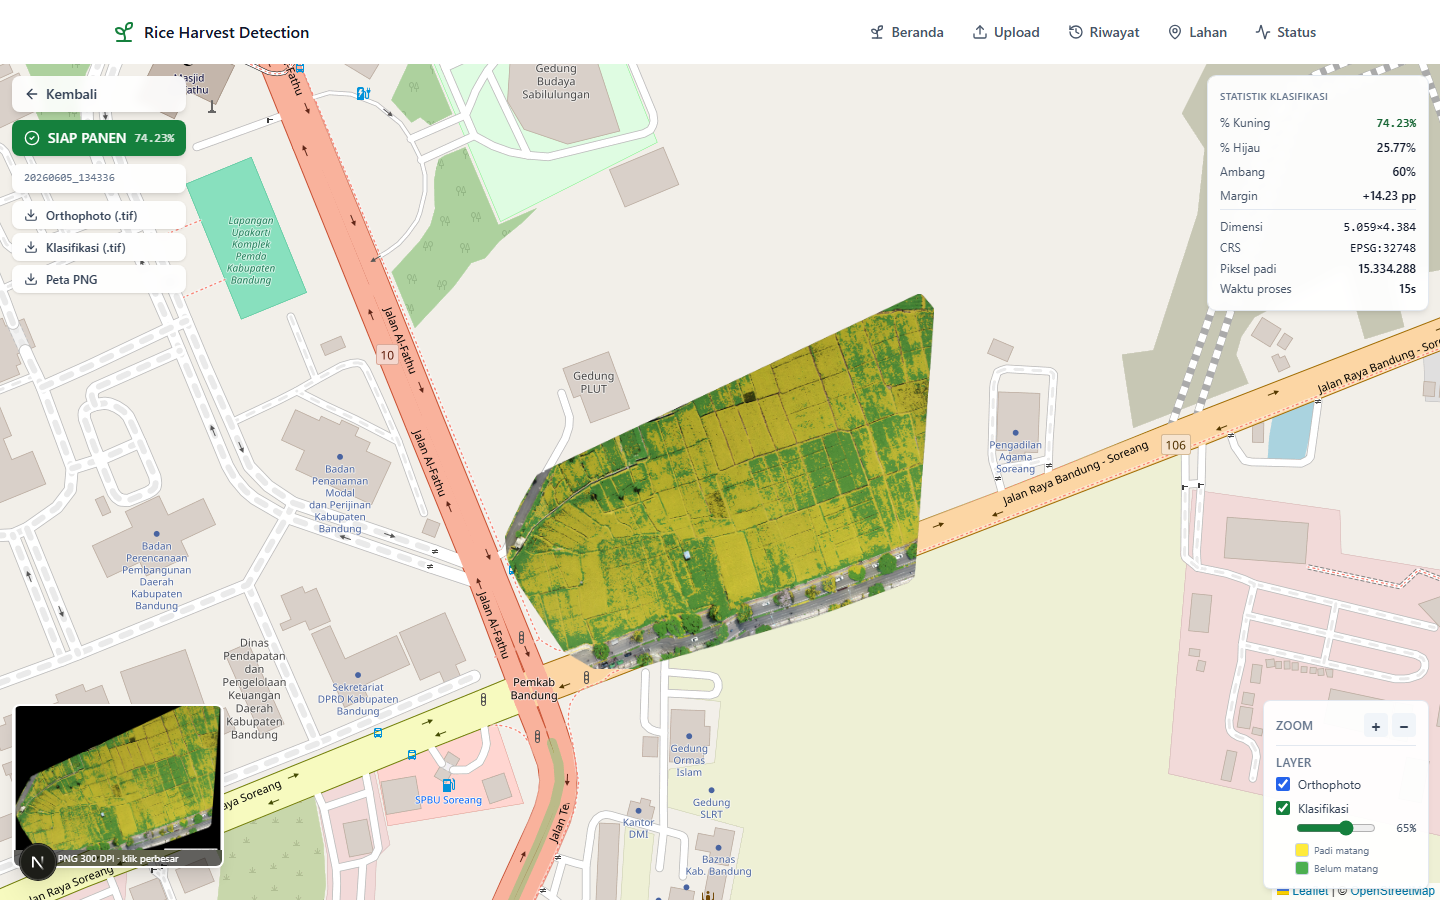
- The yellow share of all rice pixels is compared against a 60% threshold, across the whole orthophoto. The threshold can be changed per request.
- Outputs: orthophoto and classification GeoTIFFs (they open in QGIS as-is), PNG overlays for Leaflet, a 300 DPI PNG map for reports, and a JSON result.
Backend (FastAPI)
- 12 REST endpoints: stitching, job status, classification, manual upload, result list, file download, per-field history, health check, and NodeODM status.
- Stitching runs as an asynchronous job because it can take 10 minutes to several hours. Classification usually finishes in under a minute.
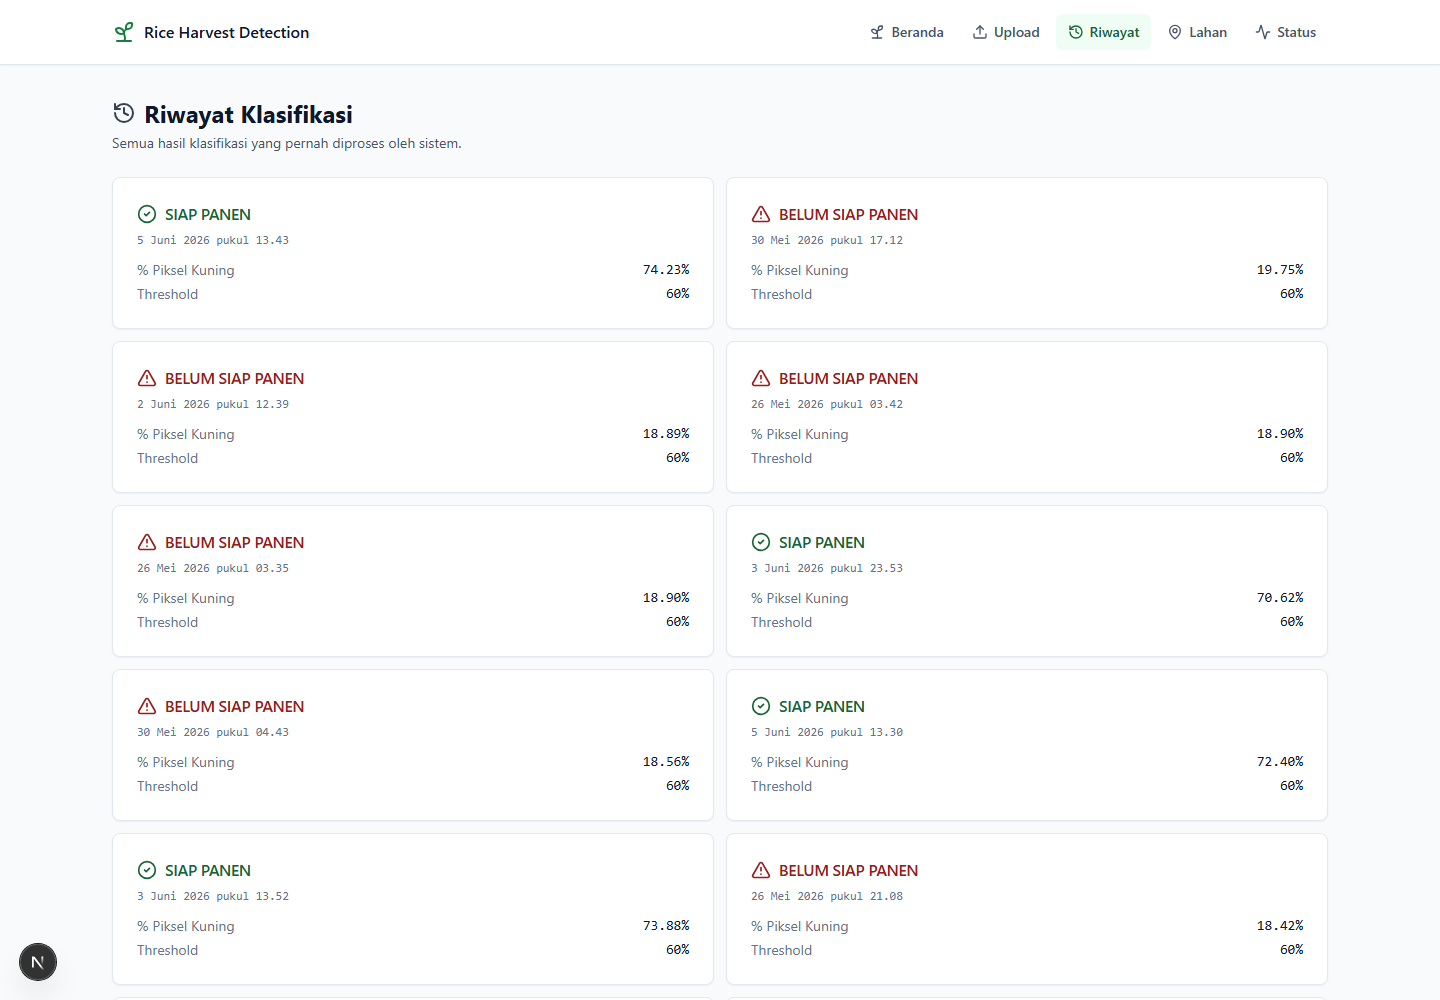
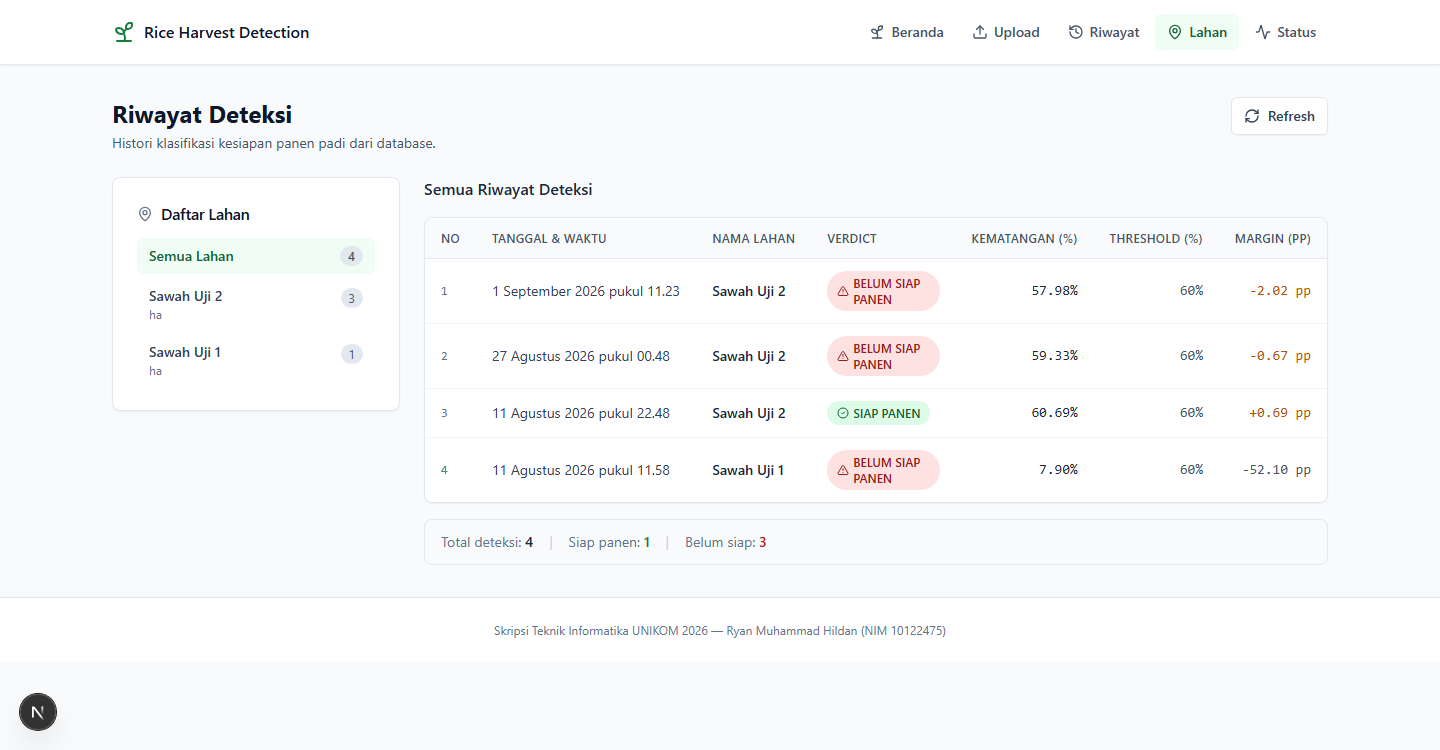
- Detection history is stored per field in SQLite.
- The same pipeline runs without the server through a CLI, with an install check and an endpoint smoke test.
- A research notebook keeps the threshold calibration: hue sensitivity tests, hue histograms, and a two-field case study.
Frontend (Next.js)
- 7 pages: home, upload, stitching progress, result list, result detail on a map, per-field history, and system status.
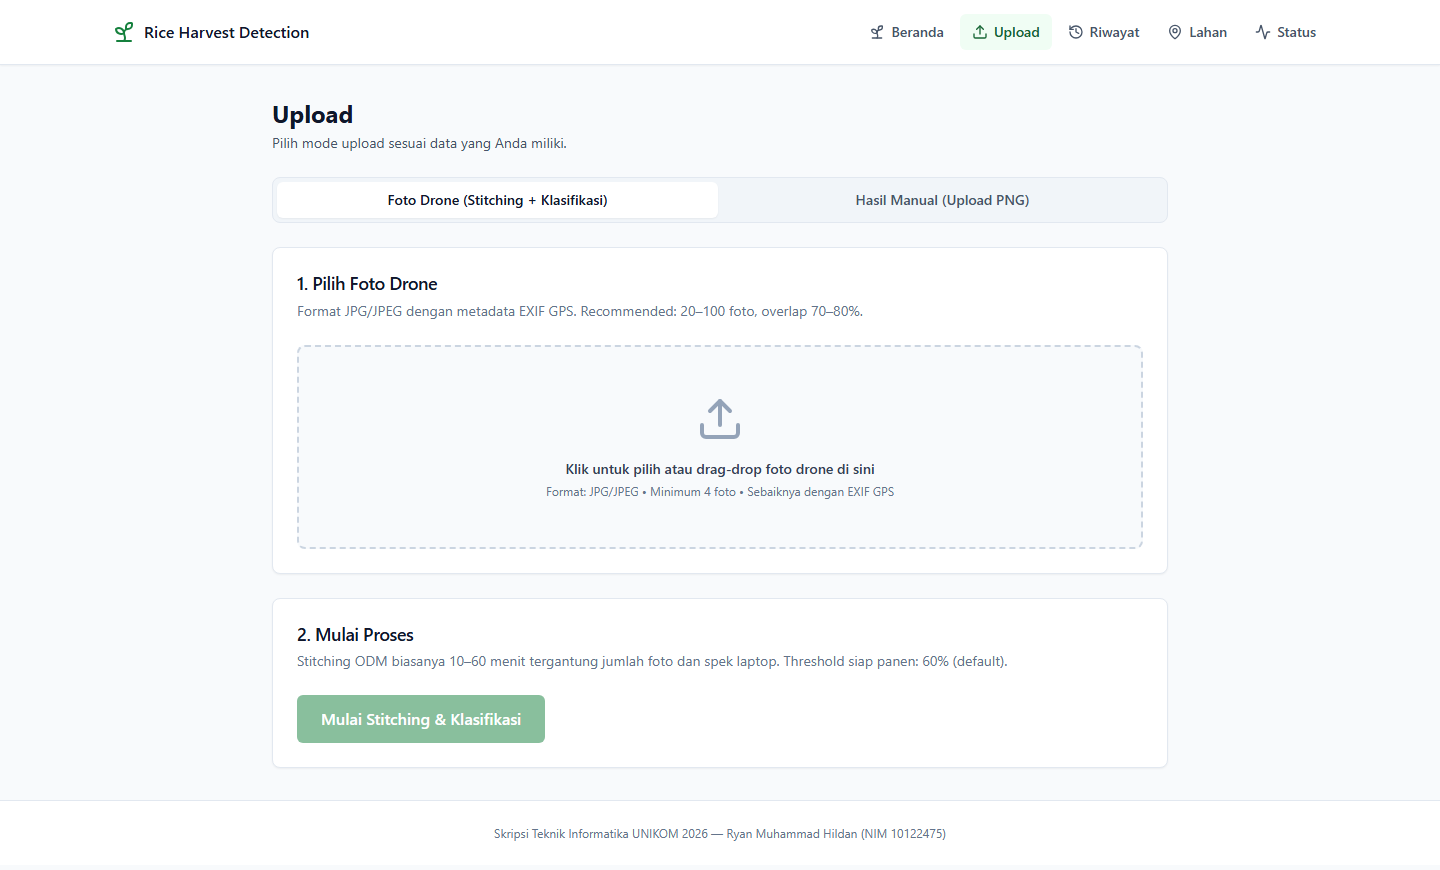
- Two upload modes: raw drone photos, or results already processed outside the system.
- A Leaflet map over OpenStreetMap that zooms to the field bounds. The orthophoto and classification layers toggle separately, with an opacity slider.
- Next.js 15, React 19, TypeScript, Tailwind CSS, and Leaflet.
Screenshots
 Open full-size image
 Open full-size image
 Open full-size image
 Open full-size image
 Open full-size image
 Open full-size image
 Open full-size image
 Open full-size image
The system reads canopy colour, not grain moisture. Its result supports a decision; it does not replace a farmer walking the field.